Wazuh is a free and open source security platform that unifies XDR and SIEM capabilities in one stack. It has four moving parts: an agent on each monitored endpoint, a manager that decodes and enriches what the agent sends, an indexer that stores and searches the result, and a dashboard that puts a face on it. In Wazuh 5.0 the agent reaches the manager over HTTPS on port 1517, the manager writes to the indexer on 9200, and detection itself runs inside the indexer.
That last sentence is the part people who know Wazuh 4.x get wrong, so this lesson spends most of its time on the data path rather than on marketing categories.
What you need
- Nothing installed. This is a concept lesson.
- If you want to follow along on a real system, start with the system requirements and sizing numbers and then install Wazuh on Ubuntu.
- Familiarity with the idea of a log shipper and a search index helps, but is not assumed.
What is Wazuh used for?
Three jobs, in the order most teams actually get value from them.
Log centralisation and search. Agents collect operating system logs, application logs, cloud provider logs and command output, ship them to the manager, and the manager puts structured documents in the indexer. You then search them. This is the SIEM half, and it works on day one.
Endpoint state and posture. File integrity monitoring, software and hardware inventory, vulnerability detection against the inventory, and security configuration assessment. These do not produce a stream of events so much as a current picture of each endpoint, stored in dedicated state indices.
Detection and response. Detection rules match against the events and produce findings. Response actions can be dispatched back to agents. This is the XDR half, and it is the part that needs your judgement, not just an install.
Wazuh also monitors devices you cannot install an agent on, by collecting their logs another way. Note one wrinkle here: in 5.0 the manager no longer runs its own syslog listener, so a network device needs an agent somewhere in the path to read its logs from a file. The log collection lesson covers that relay pattern.
The four Wazuh components
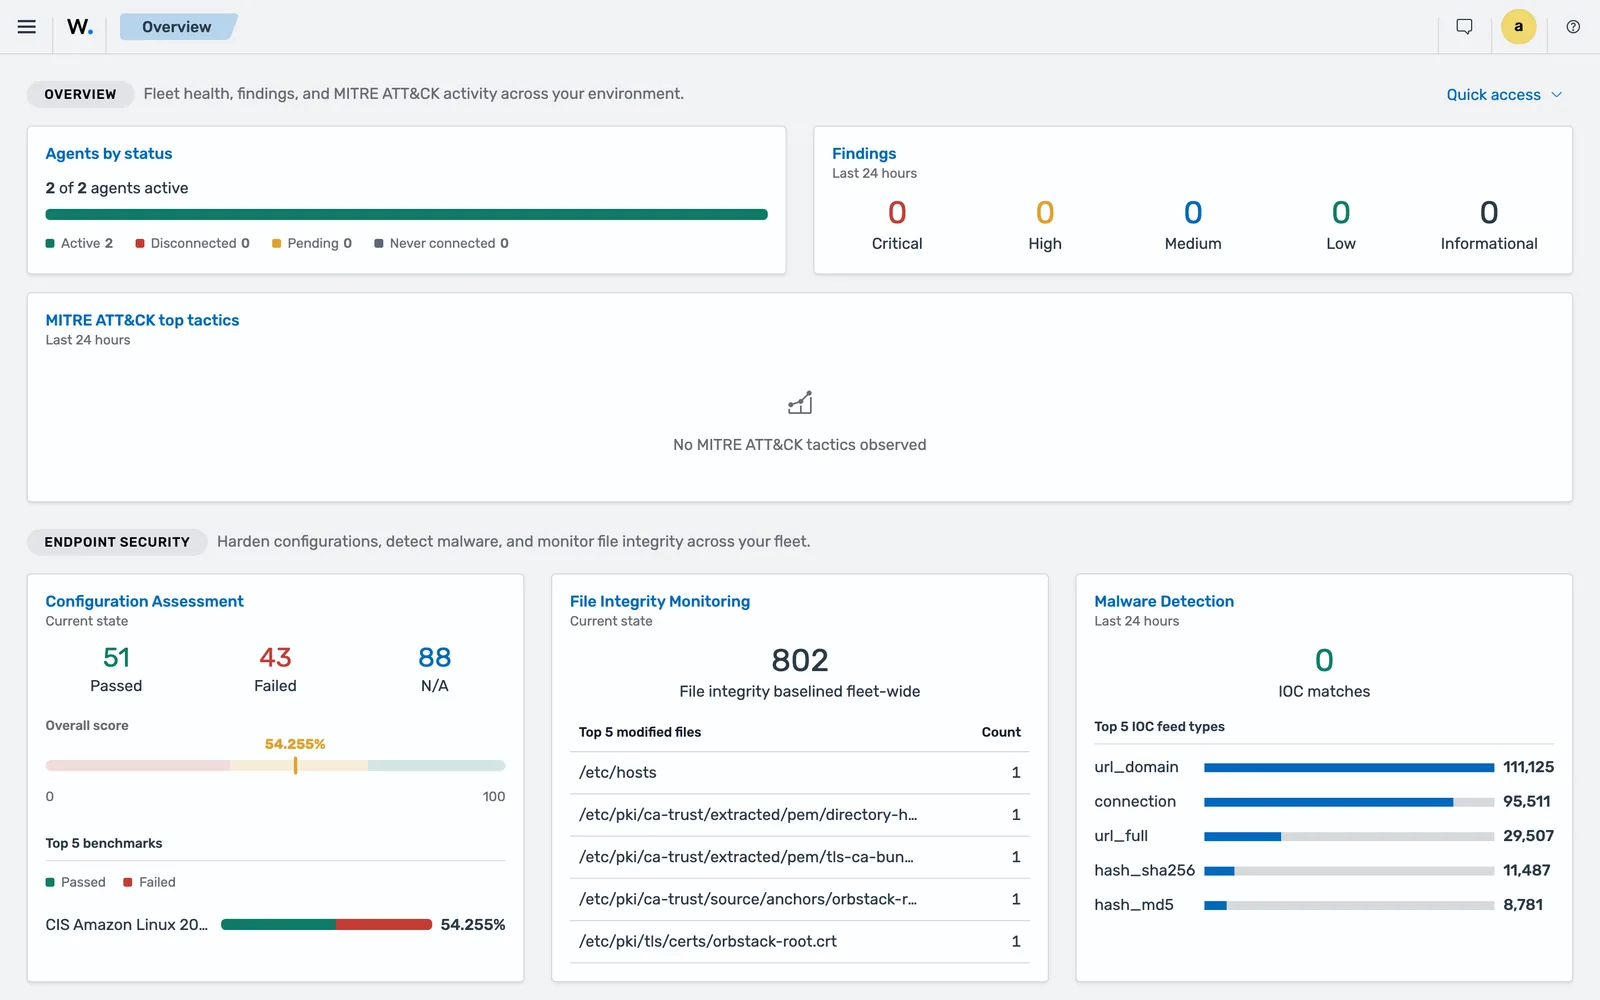
Wazuh agent. Installed on laptops, desktops, servers, cloud instances and virtual machines. Runs on Linux, Windows and macOS. In 5.0 it carries nearly all of the collection configuration itself: file integrity monitoring, log collection, configuration assessment, inventory and response scripts are configured agent-side or pushed to it as shared group configuration.
Wazuh manager. Receives data from agents and turns it into standardised schema documents using the Wazuh Common Schema, which is based on the Elastic Common Schema with a wazuh.* namespace added. It decodes, enriches with threat intelligence, and forwards to the indexer. It also owns agent registration, groups, remote upgrades and the management API on port 55000. Verified on the 5.0.0-beta5 lab, a running manager is eight daemons: wazuh-manager-clusterd, -modulesd, -monitord, -remoted, -analysisd, -db, -authd and -apid. The GitHub migration guide says monitord is going; beta5 still ships it and still starts it. The disconnected agent lesson shows the full status output.
Wazuh indexer. OpenSearch 3, with a set of Wazuh plugins bolted on. It is the central data store, and in 5.0 it is also where detection happens. The plugins provide access control, reporting, and content management for rules, decoders, integrations, key-value databases and indicators of compromise.
Wazuh dashboard. OpenSearch Dashboards with the Wazuh interface. It queries the indexer for data and the manager API for management operations, which is why it needs credentials for both.
How data flows from endpoint to finding
This is the Wazuh architecture that matters operationally. Read it as a pipeline, because that is what it is.
  ENDPOINT                MANAGER                        INDEXER                 DASHBOARD
 ┌─────────┐  HTTPS 1517 ┌──────────────────────┐  9200 ┌──────────────────┐ 443 ┌──────────┐
 │  agent  │────────────▶│ normalization engine │──────▶│ events data      │◀───▶│ browser  │
 │ (logs,  │  /enroll    │  decode → normalise  │ mTLS  │ streams          │     │   UI     │
 │  state, │  /stateless │  → enrich (geo, ASN, │       │        │         │     └────┬─────┘
 │  FIM,   │  /stateful  │     CTI indicators)  │       │        ▼         │          │
 │  SCA)   │  /control   │                      │       │ detectors (~2m)  │   55000  │
 └─────────┘  /download  │ indexer connector    │       │        │         │          │
                         └──────────┬───────────┘       │        ▼         │          │
                                    │  API 55000        │ findings data    │          │
                                    └───────────────────│ streams          │◀─────────┘
                                                        └──────────────────┘
Step by step:
- Collection. The agent reads a log file, a Windows event channel, journald, a command’s output or a cloud API, and batches what it finds.
- Transport. The agent posts to the manager on HTTPS 1517. Events go to
POST /stateless, inventory and state toPOST /stateful, control traffic toPOST /control. Every request carries a per-agent bearer token that the agent signs with its key fromclient.keys. - Normalisation. The
wazuh-manager-analysisddaemon, which the 5.0 docs call the normalization engine, decodes the raw event with YAML decoders and maps it onto the Wazuh Common Schema.full_logbecomesevent.original,data.srcipbecomessource.ip,timestampbecomes@timestamp. - Enrichment. Geolocation and autonomous system data are attached to
source.ipanddestination.ip. Indicators of compromise from Wazuh CTI are matched and written intowazuh.threat.*. - Indexing. The indexer connector writes the document to the indexer over TLS on 9200. Raw events land in
wazuh-events-raw-v5, normalised events inwazuh-events-v5-<category>where the category comes from the integration that decoded it. - Detection. Inside the indexer, detectors run as scheduled jobs and evaluate the events against Sigma-format rules. A match produces a finding in
wazuh-findings-v5-<category>. Verified on the 5.0.0-beta5 lab: 22 detectors ship enabled, on one, two or five minute periods depending on the integration. - Presentation. The dashboard reads findings, events and state indices from the indexer on 9200, and calls the manager API on 55000 for anything that changes configuration.
Where state data goes
Not everything is an event. File integrity metadata, configuration assessment results, vulnerability findings and hardware, package, process, port and user inventory go into stateful indices such as wazuh-states-fim-files, wazuh-states-sca, wazuh-states-vulnerabilities and the wazuh-states-inventory-* family. These are updated in place to reflect the current picture, not appended to. If you are used to querying alerts for “which hosts have this package”, query the state index instead.
Which ports Wazuh uses
Straight from the 5.0 architecture reference. These are defaults and all of them are changeable.
| Component | Port | Transport | Purpose |
|---|---|---|---|
| Wazuh manager | 1517/TCP | HTTPS, TLS | Wazuh 5.x agent enrolment and connection |
| Wazuh manager | 1514/TCP | Wazuh message protocol, AES | Wazuh 4.x agent connection (legacy, on by default) |
| Wazuh manager | 1515/TCP | Wazuh message protocol, AES | Wazuh 4.x agent enrolment (legacy, on by default) |
| Wazuh manager | 1516/TCP | Wazuh cluster protocol | Manager cluster communication |
| Wazuh manager | 55000/TCP | HTTPS, TLS | Manager API |
| Wazuh indexer | 9200/TCP | HTTPS, TLS | Indexer API |
| Wazuh indexer | 9300-9400/TCP | TLS | Indexer cluster communication |
| Wazuh dashboard | 443/TCP | HTTPS | Web interface |
Verified on the 5.0.0-beta5 lab: a stock manager container listens on 1514, 1515, 1516, 1517 and 55000. The shipped wazuh-manager.conf sets <remote><legacy><enabled>yes</enabled><port>1514</port><protocol>tcp</protocol> and <auth><port>1515</port>, so the 4.x channels are open from the first start, not gated behind a block you have to add. Plan for that: if you do not run 4.x agents, close 1514 and 1515 at the firewall or turn the legacy block off deliberately.
Two details that bite people. First, Wazuh 5.x agents talk on 1517 and nothing else, so opening 1514 in the firewall out of habit achieves nothing for them. Second, the manager API token from POST /security/user/authenticate expires after 900 seconds by default, while the agent bearer tokens on 1517 are short-lived and clock-sensitive. Keep NTP working on agents and manager.
A full side-by-side of 4.x and 5.0 ports, paths and log files lives in the ports and paths reference.
What Wazuh is not
Being clear about this saves an awkward conversation later.
It is not a firewall or an IPS. Nothing sits inline. Wazuh sees what an agent or a log tells it, after the fact. Response happens by dispatching a script to an endpoint, which is slower and coarser than inline blocking.
It is not a commercial EDR in the vendor sense. There is no kernel-level behavioural engine with a vendor research team tuning it against your telemetry in real time. You get inventory, file integrity monitoring, log-driven detection, and whatever detection content you or the community write. That is genuinely useful and it is not the same product category, whatever the marketing pages of either side say.
It is not a managed service. Nobody triages your findings. The stack produces them; a human or an automation decides what they mean. Budget for that. The build versus buy lesson works through the cost drivers honestly.
It is not a log archive on its own. Default retention in 5.0 keeps raw events for minutes and normalised events for about an hour, with findings kept for 90 days. If you need long-term log retention for compliance, you configure it deliberately. The retention lesson covers the index lifecycle policies.
Who Wazuh suits
It suits you if you have the operational capacity to own a platform: someone who will patch it, tune it, and read what it produces. Small teams run it happily on one box for a hundred endpoints. Large teams run it clustered across thousands.
It suits you badly if you want detections that are correct out of the box with nobody looking at them, or if your organisation cannot staff the tuning phase. An untuned SIEM is a compliance artefact, not a control.
The honest test: can you name the person who will read the findings on a Tuesday afternoon in four months’ time? If not, fix that before you fix the architecture.
Common errors
Agents cannot reach the manager although port 1517 is open
Check the URL prefix before you blame the network. The HTTPS listener ships with <global_prefix>/wazuh-manager/</global_prefix>, so the root path is not the service. Verified on the 5.0.0-beta5 lab, https://manager:1517/ answers {"error":"not_found"} while https://manager:1517/wazuh-manager/ answers {"status":"ok","module":"remoted"}. A probe against the root looks like a dead listener and is not.
The bind address is rarely the problem on a default install: beta5 ships <remote><https><bind_addr>0.0.0.0</bind_addr>, so the listener is on every interface from the first start. <cluster><bind_addr> is the one that does need attention, because it is set to the node’s own name.
A Wazuh 4.x agent will not connect to a 5.0 manager
Verified on the 5.0.0-beta5 lab, this is not a default-configuration problem: the shipped manager configuration carries <remote><legacy><enabled>yes</enabled> on port 1514/TCP and <auth><port>1515</port>, and the manager listens on both. If a 4.x agent still cannot connect, look at the agent version floor (5.0 accepts 4.x agents with reduced features, and an agent upgrade needs 4.14.0 or later) and at <remote><agents><allow_higher_versions>, which ships as no. Check your own wazuh-manager.conf if someone has edited it, because removing the <legacy> block does close those ports.
Nothing appears in the dashboard even though the manager log looks healthy
In 5.0 a healthy manager is not sufficient. Events reach the indexer, but findings only exist once a detector runs against them. If no detector is configured for the relevant category and space, you will have events and no findings. Look in the events data streams first, then check the detectors. The dashboard tour shows where each of these lives.
Searching for rule.level or full_log returns nothing
Those are 4.x field names. In the Wazuh Common Schema they are wazuh.rule.level, which is now a severity string rather than a number, and event.original. The rules and decoders lesson maps the rest of the renames.
Where to read the primary source
The component descriptions, the data flows and the port table above come from the official Wazuh 5.0 architecture documentation. The internal manager pipeline, including the bind address defaults and the enrolment path, is described in the Wazuh manager services reference. Wazuh 5.0 is in beta at the time of writing, with beta5 published in September 2026 and no release candidate or general availability date announced, so treat anything not in those pages as subject to change.
Next: Wazuh vs Splunk, Elastic, Security Onion and OSSEC.
Frequently asked questions
Is Wazuh a SIEM or an XDR?
Both, in the sense that one stack does log centralisation and search like a SIEM and endpoint telemetry, detection and response like an XDR. The official description is a unified XDR and SIEM platform. In practice you get the SIEM value on day one and the XDR value only after you have tuned detection content and decided what response you allow.
Is Wazuh free?
The platform is free and open source. Its components are released under the GNU General Public License version 2 and the GNU Affero General Public License version 3. There is a paid cloud service and paid support, but nothing in the self-hosted stack is licence-gated by endpoint count.
What port does the Wazuh agent use?
A Wazuh 5.0 agent uses HTTPS on port 1517/TCP for enrolment, events, state synchronisation and control messages. Wazuh 4.x agents use 1514/TCP for events and 1515/TCP for enrolment. Verified on the 5.0.0-beta5 lab: the shipped manager configuration enables the legacy listener, so a stock manager listens on 1514, 1515, 1516, 1517 and 55000.
Do I need the Wazuh indexer, or can I send data elsewhere?
In Wazuh 5.0 the indexer is not optional in the way Filebeat outputs were in 4.x. Detection rules, content management, threat intelligence and the dashboard all live inside the indexer. The manager writes to it through a built-in indexer connector. You can add a file output for forwarding, but the indexer is the system of record.
How many endpoints can one Wazuh server handle?
An all-in-one install on the quickstart hardware is documented as enough for up to 100 endpoints with 90 days of queryable data. Beyond that you separate the components and then cluster them. The real limit is events per second and retention, not agent count.