The Wazuh dashboard in 5.0 is OpenSearch Dashboards with Wazuh sections bolted into the same menu. The prebuilt dashboards live under Endpoint security, Threat intelligence, Security operations, Cloud security and Security analytics, with Agents management, Server management, Indexer management and Dashboard management alongside them. The concept to get right before you search anything is that Wazuh now stores three different kinds of data, in three different families of index, with wildly different retention.
What you need
- A running deployment. Start with the Ubuntu install if you do not have one.
- At least one agent in the Active state. See enrolment if yours is not.
- The dashboard on 443 and the indexer on 9200.
Change the default passwords first
Do this before you explore. A default install ships with admin:admin on the indexer, and the dashboard login is an indexer internal user.
Four accounts matter. On the indexer, admin is the administrator you log in with, and kibanaserver handles dashboard-to-indexer traffic. On the manager API, wazuh is the administrator and wazuh-wui handles dashboard-to-manager traffic.
The tool is on the indexer node:
bash /usr/share/wazuh-indexer/plugins/opensearch-security/tools/wazuh-passwords-tool.sh -u admin -p 'Secr3tP4ssw*rd'The password must be 8 to 64 characters with at least one uppercase letter, one lowercase letter, one number, and one of .*+?-. In an all-in-one deployment the tool updates the dependent components for you; in a distributed one you update the other components yourself. Change the manager API users with the -A option and the API administrator credentials:
bash wazuh-passwords-tool.sh -A -au <API_ADMIN_USERNAME> -ap <API_ADMIN_PASSWORD> -u wazuh -p 'An0therP4ss*'How the navigation is laid out
Open the menu with the icon at the top left. This is the structure read off a 5.0.0-beta5 dashboard, not the documented one, because the two differ in places:
| Section | What is in it |
|---|---|
| Home | Overview: agents by status, findings by severity, MITRE top tactics, and the endpoint security panels |
| Explore | The OpenSearch side: Discover, Visualize, Dashboards, Alerting, Notifications |
| Endpoint security | Configuration Assessment, Malware Detection, File Integrity Monitoring |
| Threat intelligence | Threat Hunting, MITRE ATT&CK, Vulnerability Detection, Case Management |
| Security operations | IT Hygiene, Regulatory Compliance, Incident Response |
| Cloud security | Docker, Amazon Web Services, Google Cloud, GitHub, Office 365, Microsoft Graph API |
| Security Analytics | Overview, Normalization (Decoders, KVDBs), Detection (Detectors, Rules), Log test |
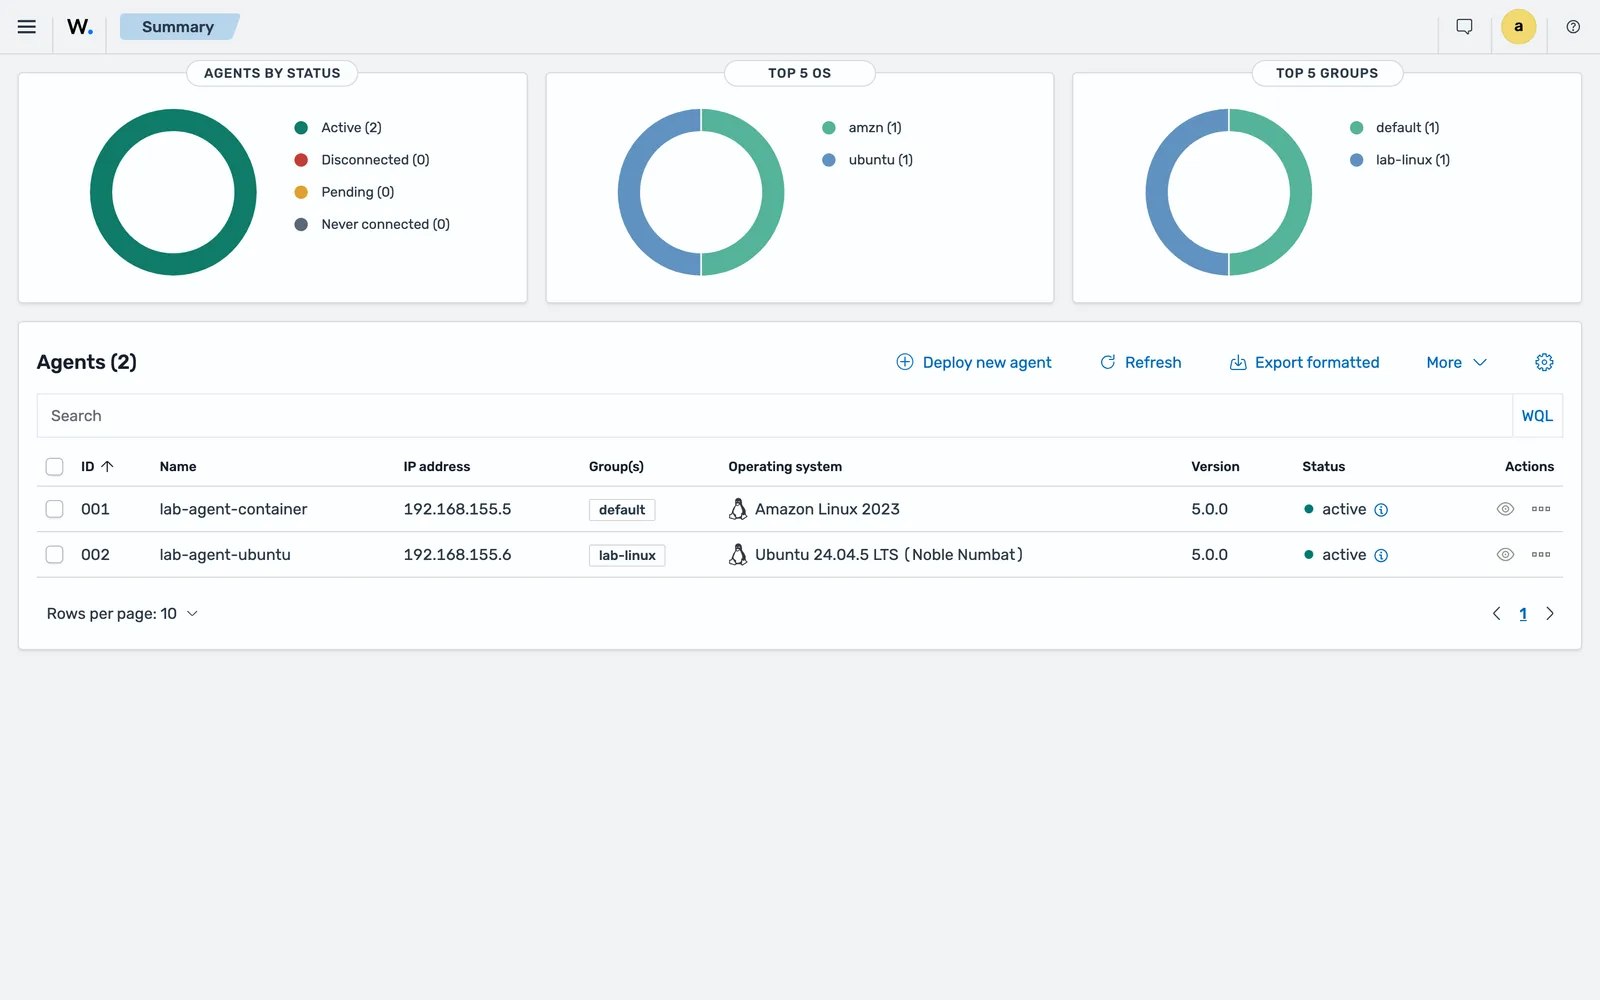
| Agents management | Summary, Groups |
| Server management | Status, Logs, Settings, Dev Tools, Security |
| Indexer management | Index Management, Snapshot Management, Security, Dev Tools, Settings |
| Dashboard management | Data sources, Saved Objects, Advanced settings |
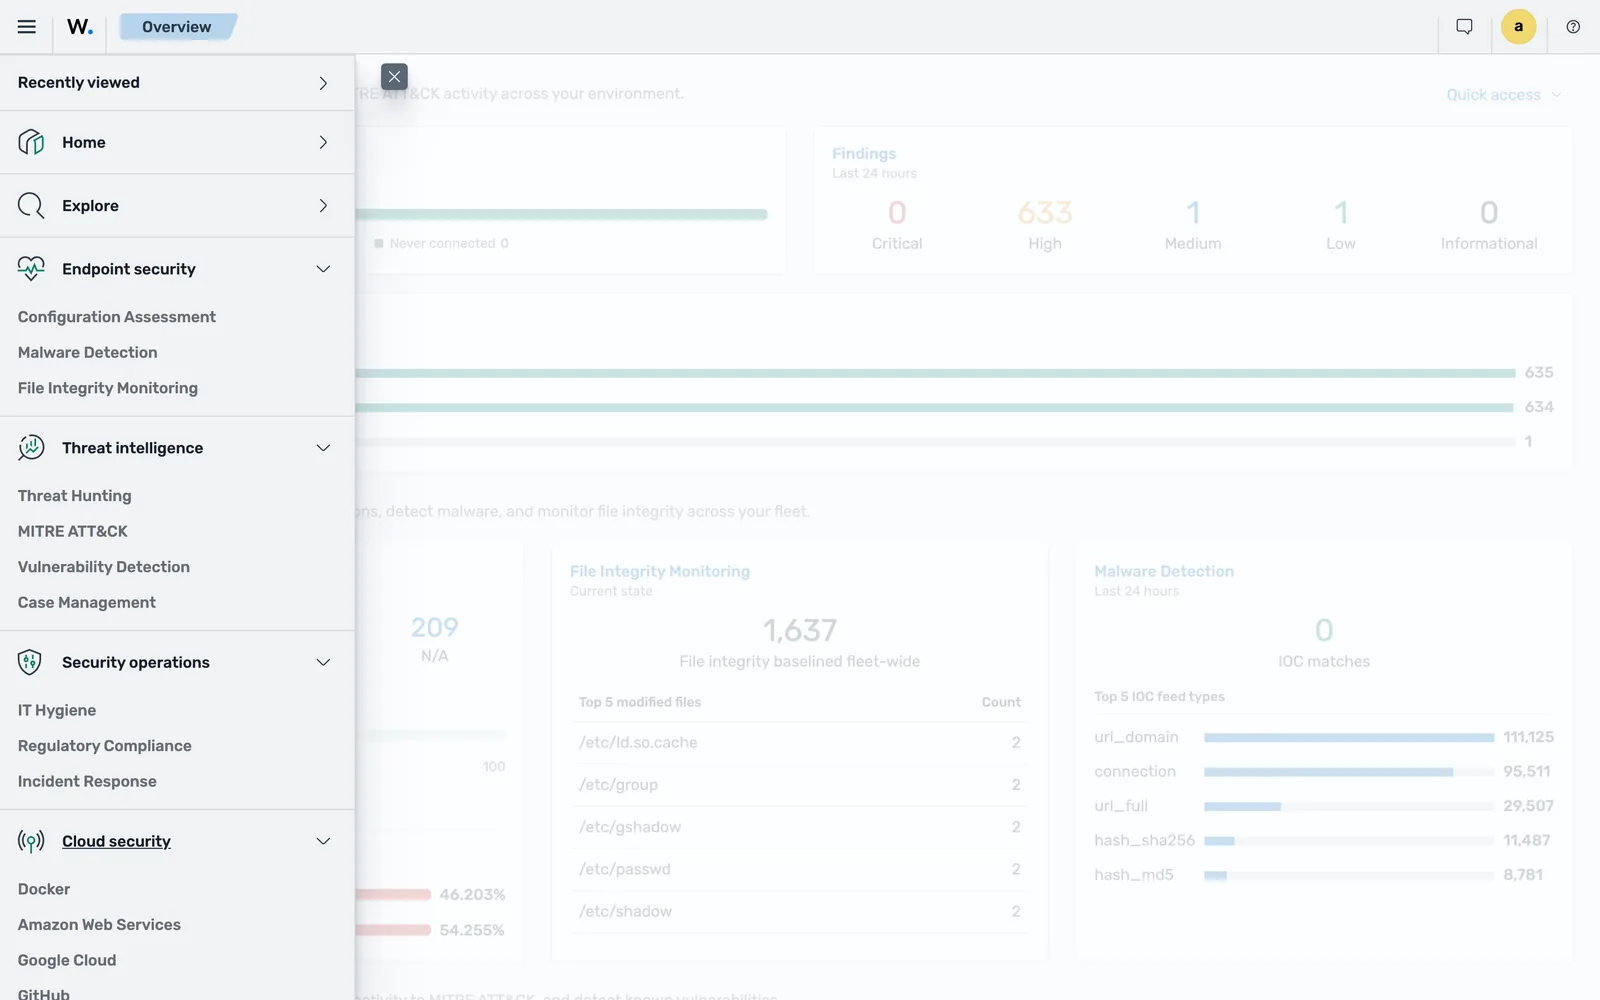
Two corrections worth making if you read an earlier account of the 5.0 layout. There is a Home page, and it opens on Overview rather than on an empty shell. And Security Analytics lives at /app/sa-integrations with its own left-hand navigation and a Space selector across the top offering Draft, Test, Custom and Standard, rather than being a set of pages in the main menu.
Regulatory Compliance also has more in it than the beta documentation suggests. On beta5 it carries tabs for PCI DSS, GDPR, HIPAA, NIST 800-53, NIST 800-171, TSC, CMMC, FedRAMP, ISO 27001 and NIS2.
Four places are worth visiting on day one. Agents management > Summary is your coverage view. Server management > Logs shows /var/wazuh-manager/logs/wazuh-manager.log without an SSH session. Server management > Dev Tools runs manager API queries, and Indexer management > Dev Tools runs indexer queries; between them you can answer most questions without a terminal. Security Analytics > Log test tells you how a given log line is parsed and whether it matches a rule, though it only works in the test, custom and standard spaces, not in draft.
Events, findings and states are three different things
This is the part that makes or breaks your first week.
An event is a log after the normalization engine has decoded and enriched it. Every event that arrives becomes a Wazuh Common Schema document, whether or not anything was detected. Events keep the original log line in event.original.
A finding is what a detector produced when a Sigma rule matched an event. A finding is the 5.0 word for what 4.x called an alert, and it carries the detection result, the triggering event, rule metadata, and investigation fields such as case status, analyst comments and tags. Each active policy gets its own copy of the raw event, so one incoming log can produce several findings.
A state is the current condition of an endpoint rather than something that happened: which packages are installed, which ports are open, which files are being watched, which configuration checks pass, which vulnerabilities apply. States are updated in place, not appended.
The storage follows the same split:
| Family | Examples | Holds |
|---|---|---|
| Event data streams | wazuh-events-raw-v5, wazuh-events-v5-{category}, wazuh-events-v5-unclassified |
Everything received, before and after normalization |
| Findings data streams | wazuh-findings-v5-{category} |
Rule matches |
| Stateful indices | wazuh-states-fim-files, wazuh-states-sca, wazuh-states-vulnerabilities, wazuh-states-inventory-* |
Current endpoint state |
The categories on the event and findings streams are the integration categories: system-activity, security, access-management, applications, network-activity, cloud-services and other, plus unclassified for anything the pipeline could not place.
The retention trap
Read this table before you plan any hunting.
| Data stream | Default retention |
|---|---|
wazuh-events-raw-v5 |
10 minutes |
wazuh-events-v5-* |
1 hour |
wazuh-findings-v5-* |
90 days |
wazuh-active-responses |
3 days |
wazuh-metrics-* |
30 days |
Those defaults were read back from a beta5 stack, from the stream-raw-events-policy, stream-events-policy, stream-findings-policy, stream-active-responses-policy and stream-metrics-policy Index State Management policies the Setup plugin creates. Rollover happens at 20 GB primary shard size or 200 million documents, whichever comes first.
An hour of events is not a typo. The design assumes findings are the durable record and events are working material. If your investigation habit is to pivot from a finding to the surrounding raw events, that habit needs a retention change first, not a dashboard trick.
Retention is changed through Index State Management under Indexer management > Index Management. Doing it properly, including the disk arithmetic, belongs in upgrade, backup and index retention.
Search your findings
Prebuilt dashboards answer the questions someone else anticipated. Discover answers yours. The beta documentation references Discover in the AI Assistant flow and in Advanced settings, but gives no walkthrough of it; you will find it in the same Explore menu as Visualize, Dashboards, Alerting and Notifications, which are documented there.
Point it at wazuh-findings-v5* for detections and wazuh-events-v5* for the stream of everything. Both patterns exist on a beta5 install; the beta documentation’s own examples also use the short forms (wazuh-events*, wazuh-findings*), so check what your install created under Dashboard management before scripting against a name.
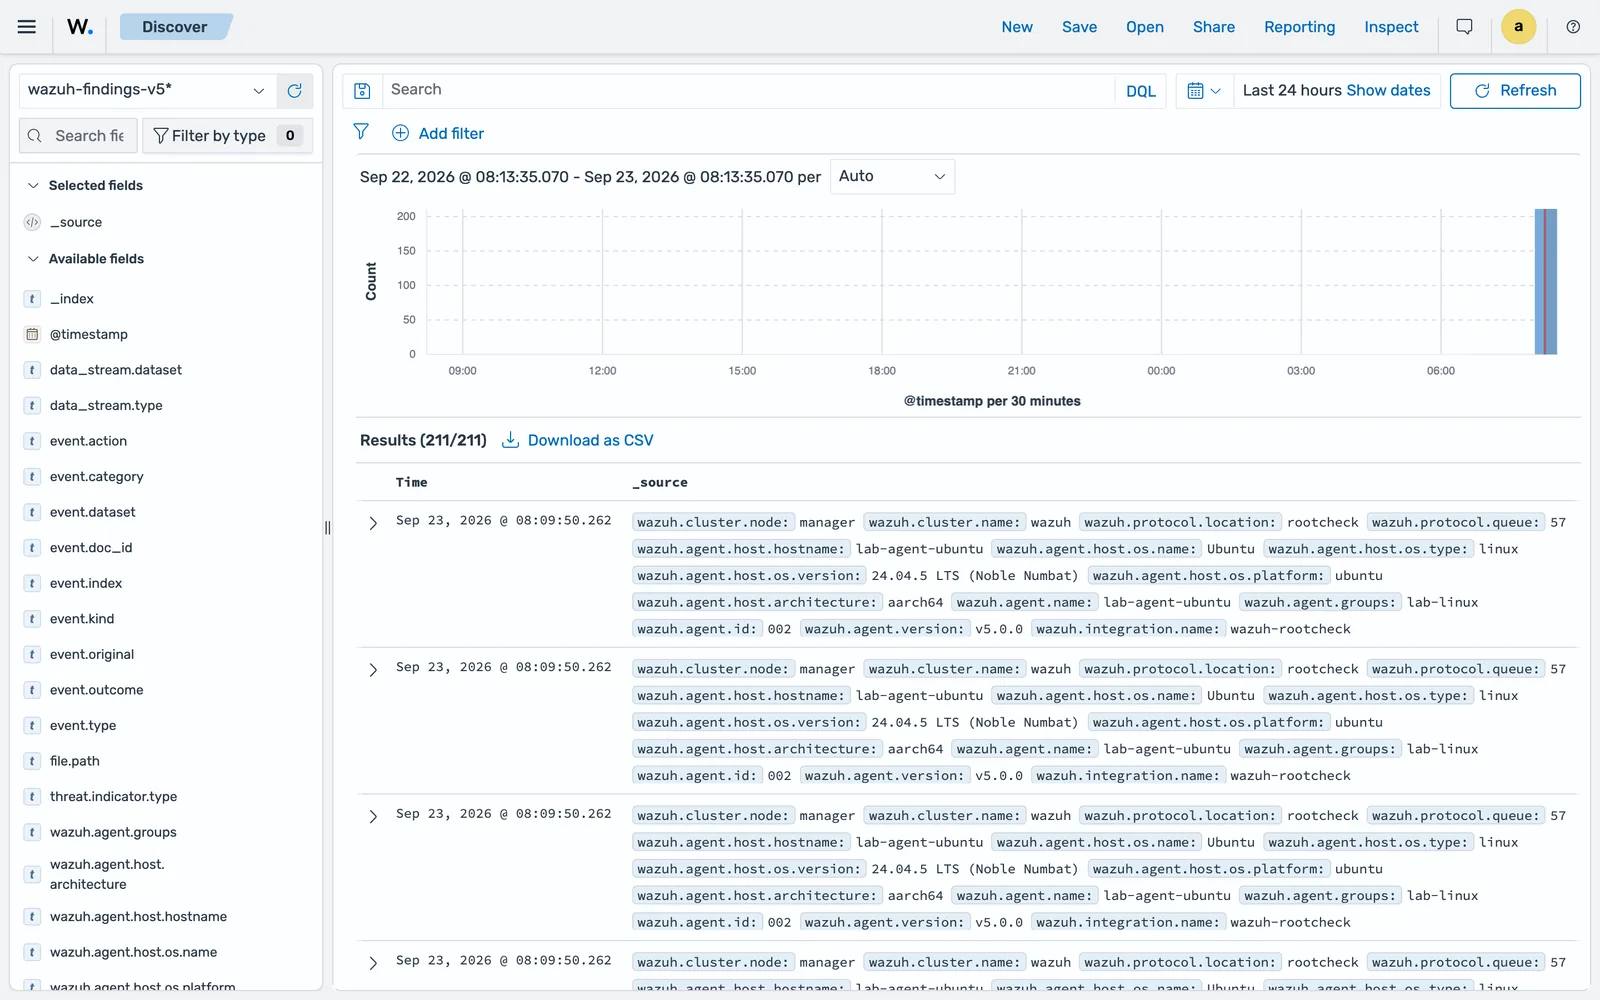
wazuh-findings-v5*. The available fields list on the left is the fastest way to learn the Wazuh Common Schema names you will be filtering on.The fields you will filter on constantly:
| Field | What it is |
|---|---|
@timestamp |
Event time. Was timestamp in 4.x |
event.original |
The raw log line. Was full_log |
wazuh.agent.name, wazuh.agent.id |
Which endpoint |
wazuh.agent.groups |
Which group, on every document |
wazuh.rule.level |
Severity, now a string, not an integer |
wazuh.rule.id, wazuh.rule.sigma_id |
The rule that fired. Findings carry both, and on beta5 they hold the same UUID |
event.action |
What happened, for example authentication-failure |
source.ip, destination.ip |
Was data.srcip and data.dstip |
file.path |
Was syscheck.path |
wazuh.integration.name, wazuh.integration.category |
Which content produced it |
wazuh.rule.level being a string matters more than it looks. The 4.x habit of filtering rule.level > 10 does not translate: severity is now one of informational, low, medium, high or critical. Filter on the value, not on a comparison.
Save a search once it is useful. Saved searches feed the Reporting plugin, which exports PDF and CSV, and they become the starting point for a visualisation.
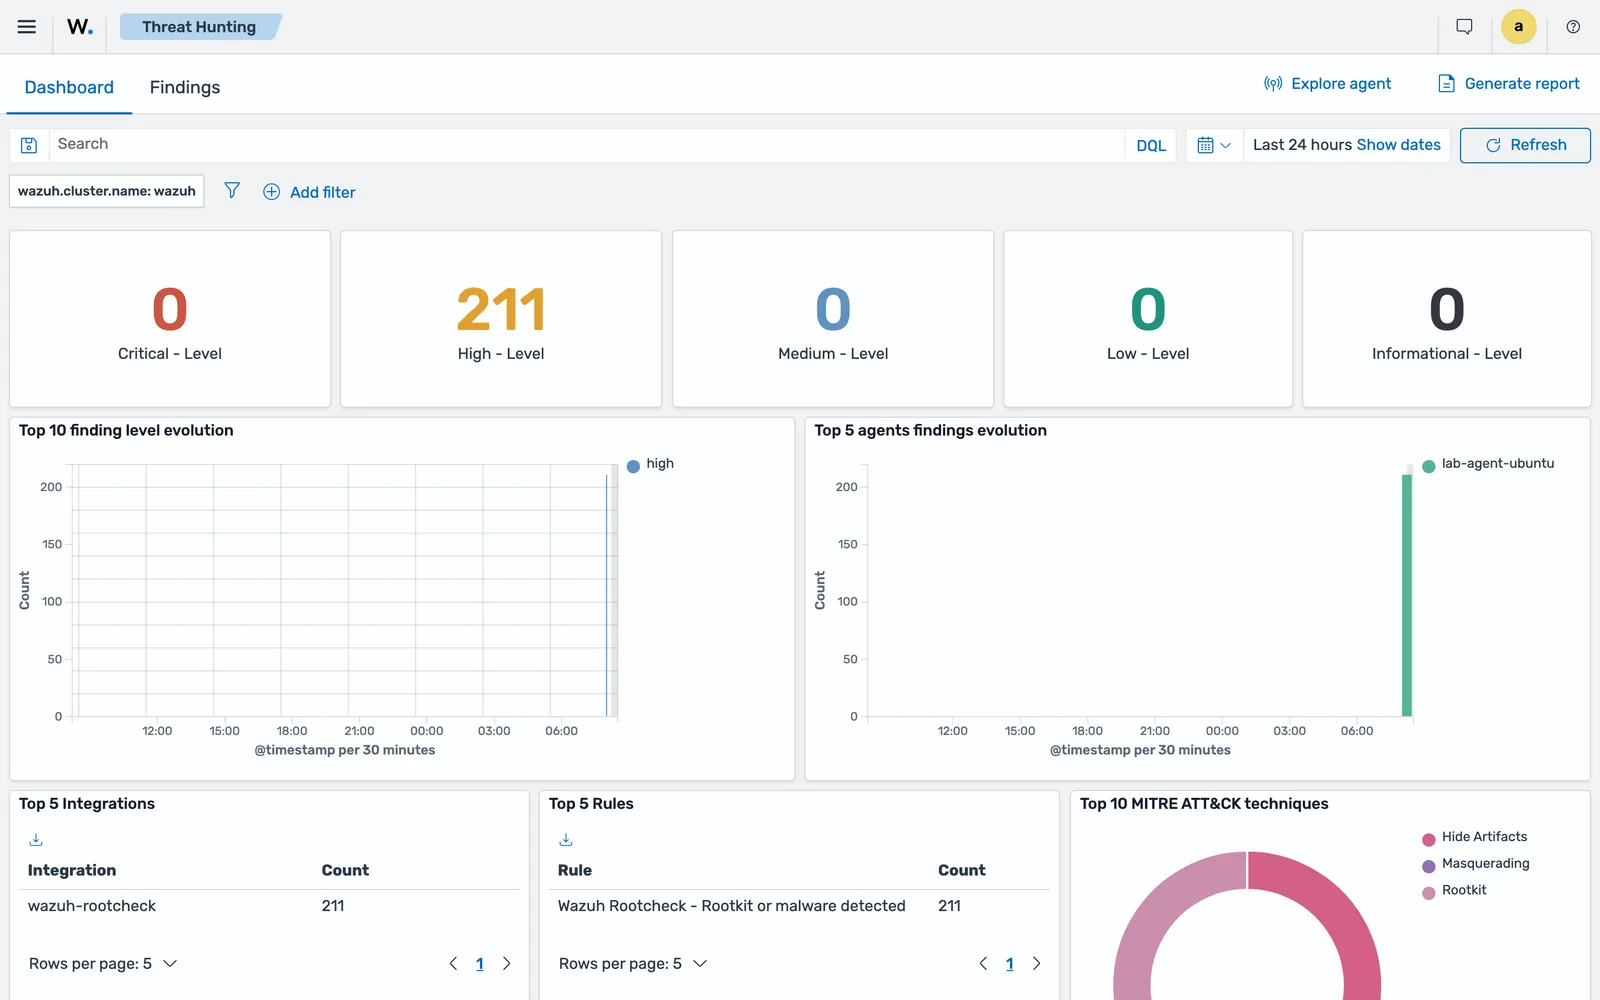
Between Discover and the prebuilt pages sits Threat Hunting, which is the one prebuilt dashboard worth learning properly. It counts findings by severity, breaks them down by agent, integration and rule, and maps them onto MITRE ATT&CK techniques.
Build one visualisation
The fastest way to prove the data is flowing is a count of findings by severity. Under Explore > Visualize, create a Data Table on the wazuh-findings-v5* index pattern, set the metric aggregation to Count, add a Split rows bucket with a Terms aggregation on wazuh.rule.level, order by Count descending, size 5, then Update and Save.
Swap wazuh.rule.level for wazuh.integration.category to see which log sources are actually feeding you, which is usually more revealing on a new deployment. A category with no documents means content that is not reaching the indexer, and that is a collection problem, not a detection problem.
Where the state data lives
The state pages read indices, not streams, and each one has a home in the menu:
- Security operations > IT Hygiene reads
wazuh-states-inventory-*: hardware, packages, processes, ports, services, users, groups, browser extensions and more. - Threat intelligence > Vulnerability detection reads
wazuh-states-vulnerabilities. - Endpoint security > File integrity monitoring reads
wazuh-states-fim-files,wazuh-states-fim-registry-keysandwazuh-states-fim-registry-values. - Security configuration assessment results are in
wazuh-states-sca.
One beta caveat before you read anything into an empty state page. For about fifteen minutes after startup the beta5 lab manager logged wazuh-manager-remoted:forwarder: WARNING: The inventory sync server answered HTTP 503 every two minutes, and wazuh-states-inventory-* and wazuh-states-vulnerabilities sat at zero while events, findings and wazuh-states-sca filled normally. It cleared on its own and the state indices then populated. On a newly built stack, check the manager log and wait before concluding that an agent is not collecting.
Two consequences of the state model. First, these pages show current state, so an absence is as meaningful as a presence: a package that disappeared from inventory was removed. Second, the manager API no longer exposes /sca/{agent_id}, /syscheck or /syscollector, so automation that used to read them queries the indexer on 9200 instead. That shift is covered in the Wazuh API with Python.
Common errors
Wazuh manager API seems to be down
The dashboard cannot reach the manager API on 55000.
Fix: check the service with systemctl status wazuh-manager, then test from the dashboard host:
curl -k -X GET "https://<api_url>:55000/?pretty=true" -H "Authorization: Bearer $(curl -u <api_user>:<api_password> -k -X POST 'https://<api_url>:55000/security/user/authenticate?raw=true')"A healthy API returns a JSON object with title, api_version and revision. A dead one returns curl: (7) Failed to connect to 127.0.0.1 port 55000 after 0 ms: Couldn't connect to server. Restart the manager if so.
Could not connect to API with id: default: 3003 - Missing param: API USERNAME
The dashboard configuration is missing or misnaming the manager API credentials.
Fix: in /etc/wazuh-dashboard/opensearch_dashboards.yml, the block is wazuh_core.hosts with username (not user), password, url, port and run_as: true. Default credentials foo:bar are not accepted.
Saved object for index pattern not found
The dashboard cannot find the saved object that defines an index pattern, which typically happens when the indexer is reinstalled while the dashboard keeps running.
Fix: restart the dashboard, which reinitialises saved objects:
systemctl restart wazuh-dashboardIf that does not resolve it, the documented manual route is to stop the dashboard, inspect the type field mapping on the .kibana* indices, delete the affected index, and restart.
Application Not Found
Seen after an upgrade when the dashboard configuration file was not updated.
Fix: set uiSettings.overrides.defaultRoute: /app/wz-home in /etc/wazuh-dashboard/opensearch_dashboards.yml.
No data anywhere
Before blaming the dashboard, ask the indexer directly:
curl https://<WAZUH_INDEXER_IP>:9200/_cat/indices/wazuh* -u <WAZUH_INDEXER_USERNAME>:<WAZUH_INDEXER_PASSWORD> -kYou should see backing indices named .ds-wazuh-events-v5-* and .ds-wazuh-findings-v5-* alongside the wazuh-states-* indices. Document counts of zero on the findings streams with healthy event streams point at detection, not collection. Zero on both points at the agent or the manager, and the trail continues in agent disconnected or never connected.
Version mismatch
The manager and dashboard must run the same major and minor version. A mismatch produces an explicit error on login and is worth checking first after any partial upgrade.
Where to go next
The section-by-section reference is the official Navigating the Wazuh dashboard page, and the index families are documented in the Wazuh indexer indices reference beside it.
You now know where data lands and what it is called. The next question is how it got there and why some events produce findings and others do not, which is rules, decoders and severity levels explained. When you want the dashboard to tell you about something rather than waiting for you to look, the path runs through alerting monitors and notification channels in Wazuh notifications. And the field renames from 4.x are collected in what changes in Wazuh 5.
Next: Wazuh Rules, Decoders and Severity Levels Explained.
Frequently asked questions
What is the difference between an alert and a finding in Wazuh?
Finding is the 5.0 word for what 4.x called an alert. A finding is produced when a Security Analytics detector matches a Sigma rule against a normalised event, and it is stored in a wazuh-findings-v5 data stream. The word alert survives only in the OpenSearch Alerting plugin, which is a separate notification mechanism.
What is the Wazuh dashboard index pattern in 5.0?
There is no single wazuh-alerts-* pattern any more. Normalised events go to wazuh-events-v5-{category}, detections to wazuh-findings-v5-{category}, and current endpoint state to wazuh-states-* indices. Search wazuh-events-v5* and wazuh-findings-v5* respectively.
Why can I not find yesterday's events in the Wazuh dashboard?
Default retention on the event data streams is very short: 10 minutes for wazuh-events-raw-v5 and 1 hour for wazuh-events-v5-*. Findings are kept 90 days by default. If you need event history for hunting, raise those Index State Management retention periods before you need them.
How do I change the Wazuh admin password?
Use the Wazuh passwords tool at /usr/share/wazuh-indexer/plugins/opensearch-security/tools/wazuh-passwords-tool.sh, for example bash wazuh-passwords-tool.sh -u admin -p 'NewPassw*rd1'. The password must be 8 to 64 characters with an uppercase letter, a lowercase letter, a number and one of . * + ? -
Where do I find agent inventory and vulnerabilities in the dashboard?
System inventory is under Security operations > IT Hygiene and reads the wazuh-states-inventory-* indices. Vulnerabilities are under Threat intelligence > Vulnerability detection and read wazuh-states-vulnerabilities. Both hold current state rather than a stream of events.